

CLARITY AT A GLANCE
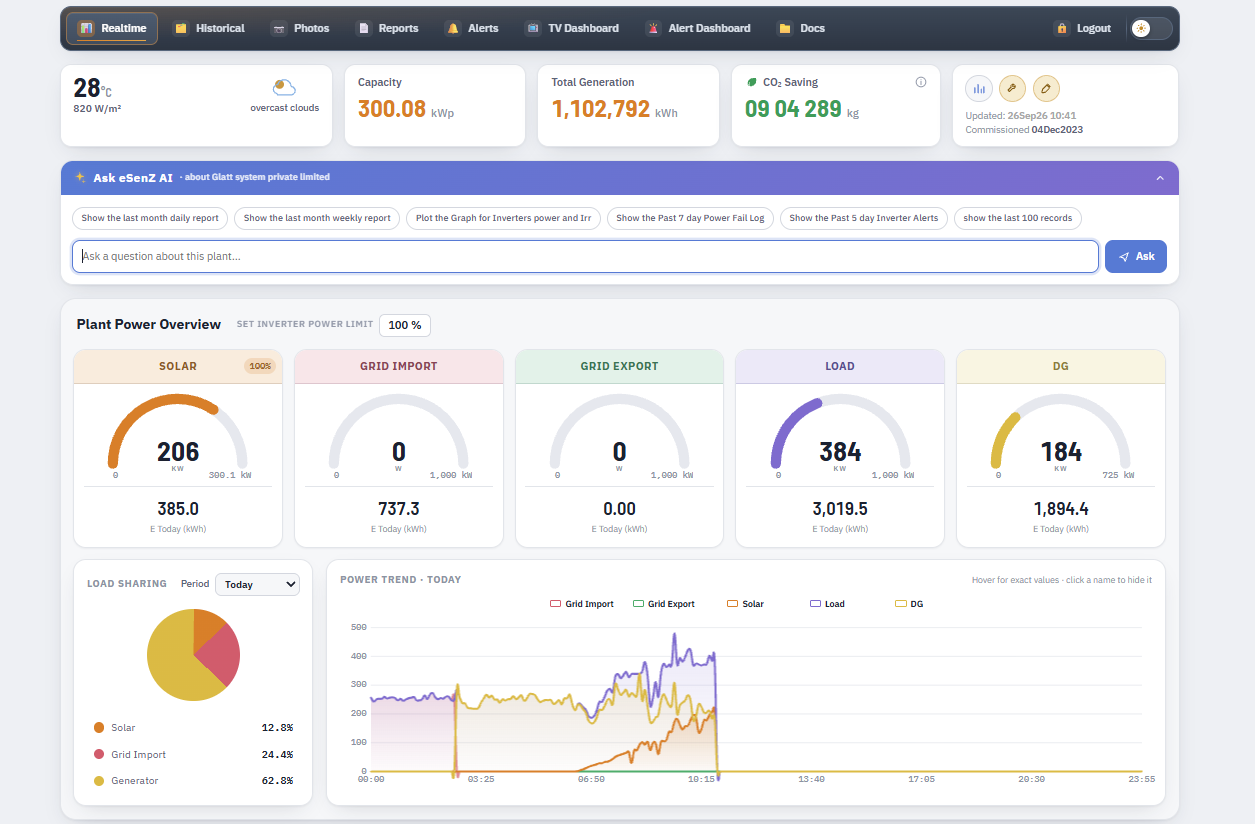
Customer dashboard
An AI-integrated dashboard that keeps monitoring smart, simple and clear.
What you can do
Simple gauges with AI-integrated insights
Clear reports for everyday monitoring
GO DEEPER INTO YOUR DATA
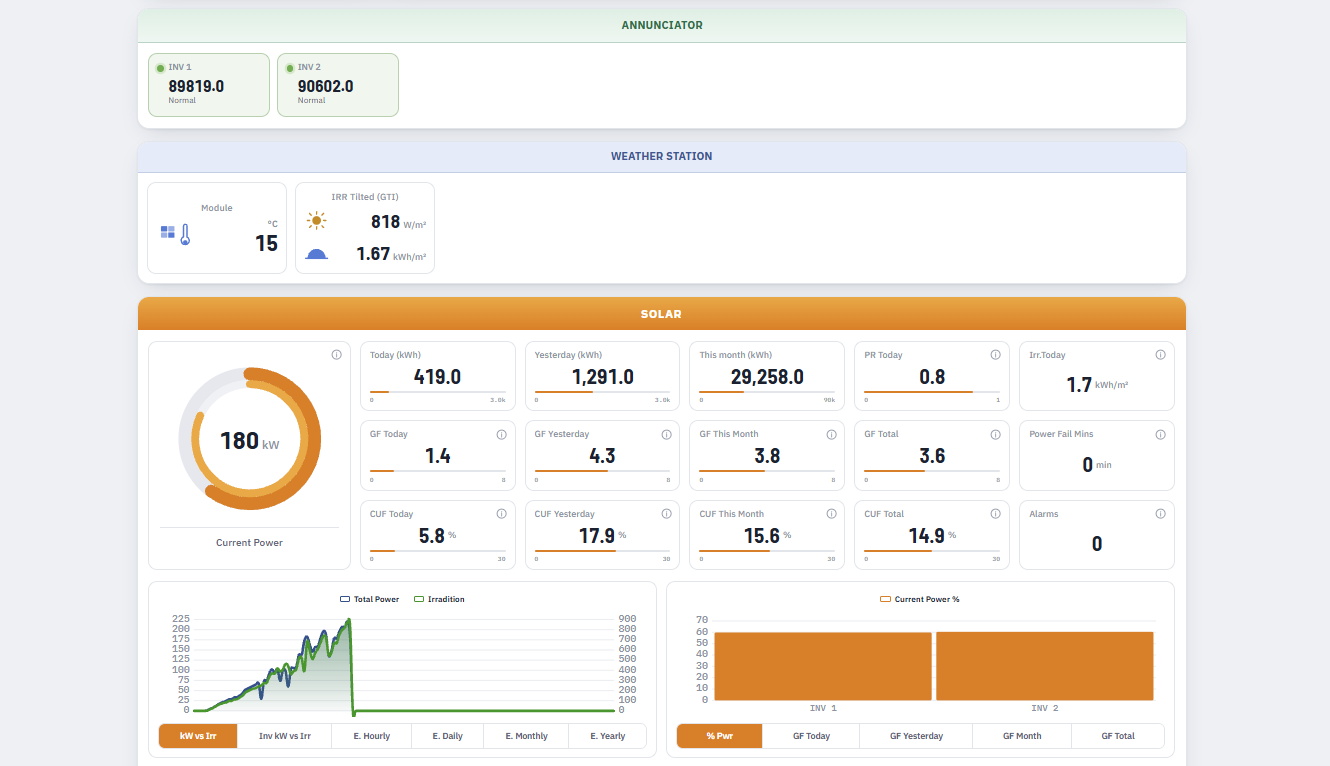
Admin dashboard
AI-integrated tools, charts and graphs to help you analyse system performance.
What you can do
Real-time and historical data with detailed reports
Alerts, fault investigation and performance analysis
AI-integrated charts and advanced analysis tools
LARGE PLANTS. CLEAR VISIBILITY.
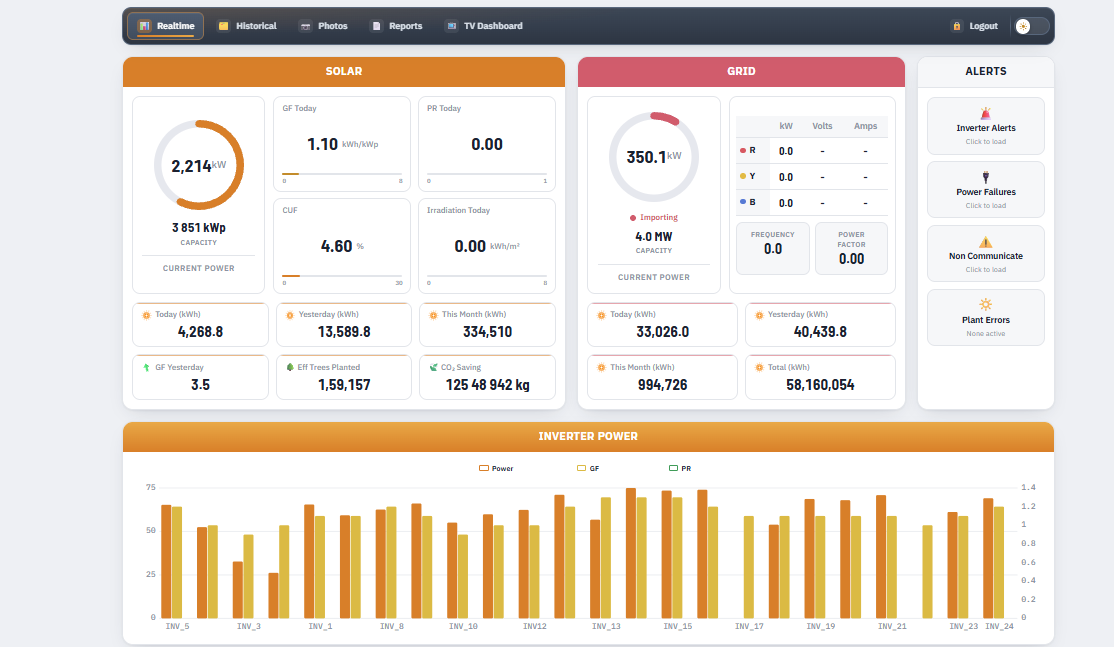
Megawatt dashboard
A dedicated dashboard for monitoring megawatt plants.
What you can do
Solar and grid visibility across inverters, strings and transformers
Large-scale data monitoring with FTP integration
Alerts, reports and live performance analysis
EVERY SITE, TOGETHER
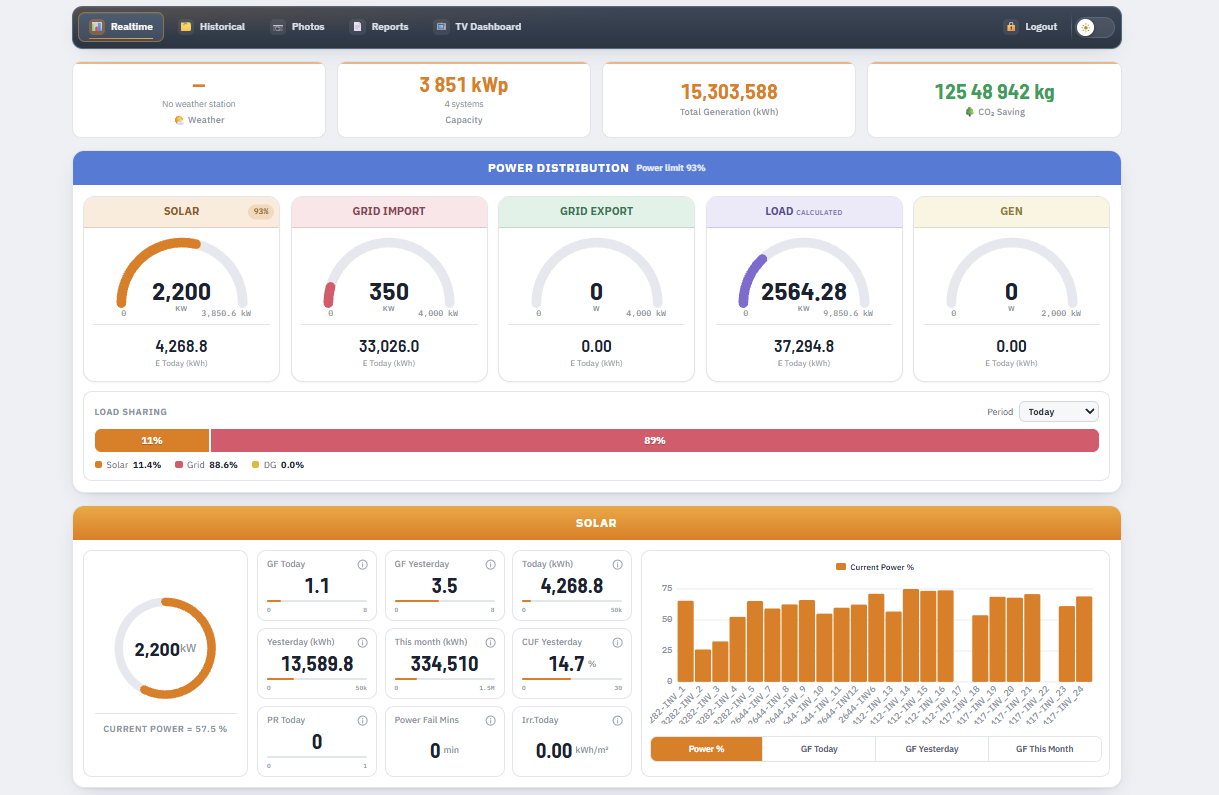
Multiple system dashboard
A single dashboard for monitoring multiple systems together.
What you can do
Compare system performance across sites
See which sites need attention
Review alerts and reports for each system
ORGANISED AROUND YOUR PROJECTS
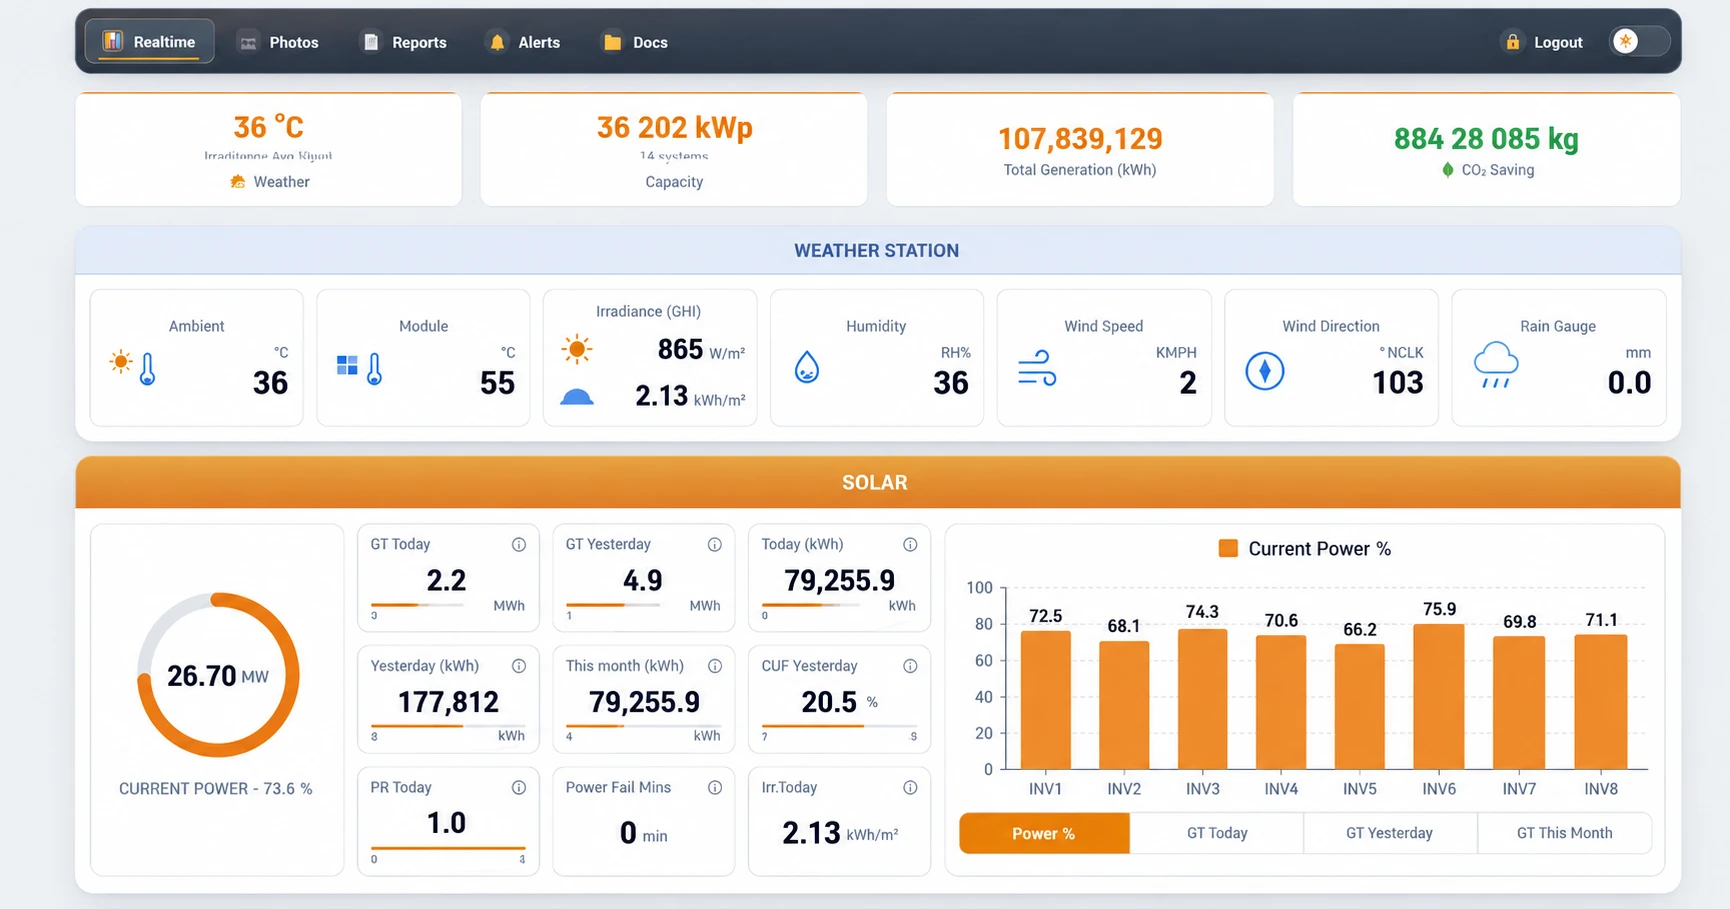
Project dashboard
Group your installations into projects and monitor them together.
What you can do
Keep related installations in one view
Track project performance and faults
Review alerts and reports by project
YOUR COMPLETE PORTFOLIO
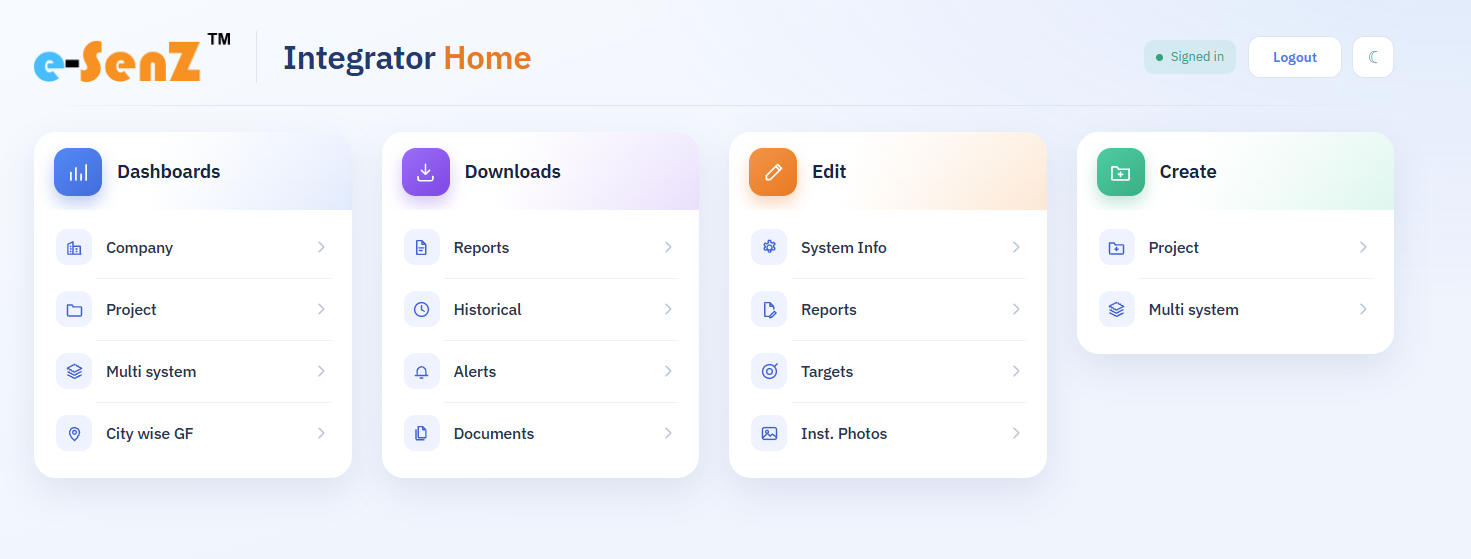
Company dashboard
View all your installations on one screen.
What you can do
See performance across your company
Spot installations that need attention
Keep an overview of alerts, faults and reports
Stay informed
Review alerts to see which installations or systems need attention. Use the dashboard's scope to focus on your site, project or portfolio.
Understand performance
Use reports to review generation and system performance, and share a clear picture with your team.
Investigate faults
Review available system data and performance information to support fault investigation and plan your next action.